

Shattering the Myth? Audiences’ Relationship to Local Media and Local News Revisited
Figures
Figure 1: Audiences’ interest in news topics
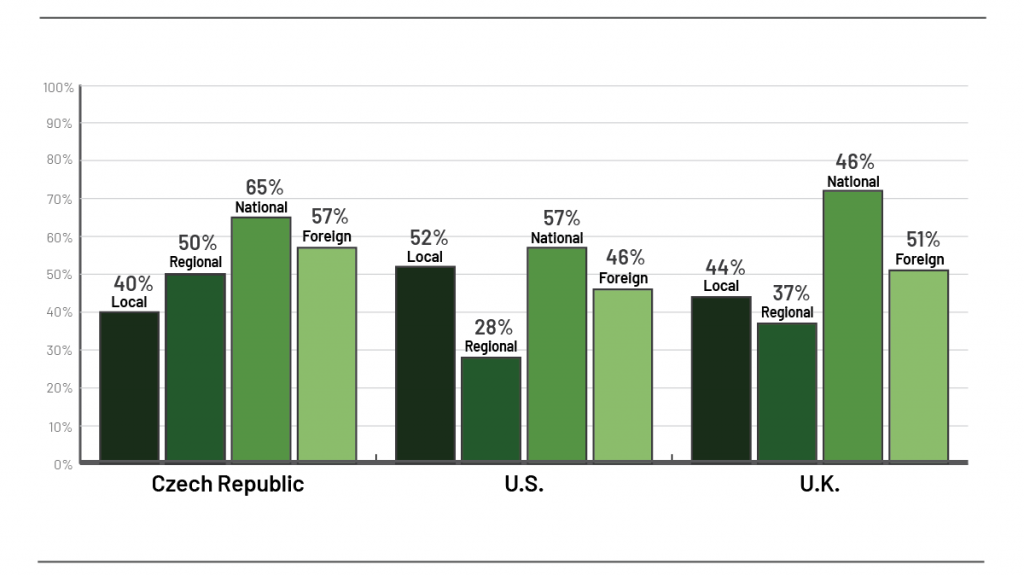
Sources: Reuters Institute digital news report 2015; Reuters Institute digital news report 2015, supplementary report.
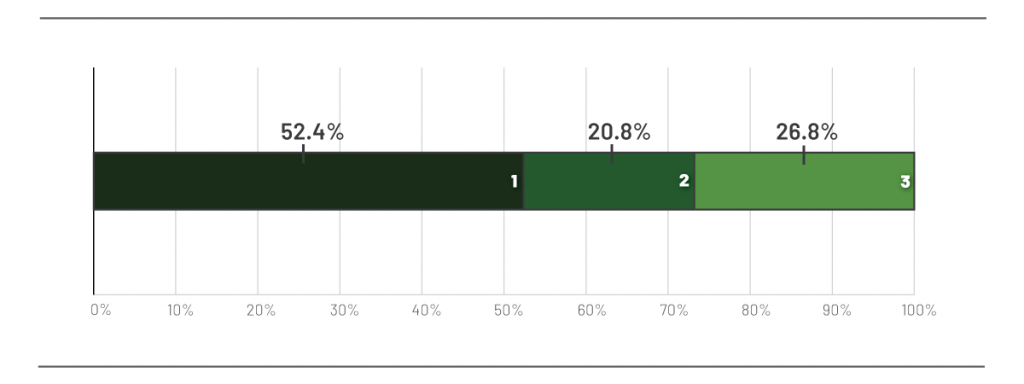
Figure 2: Distribution of interest in particular news types (n=1,998)
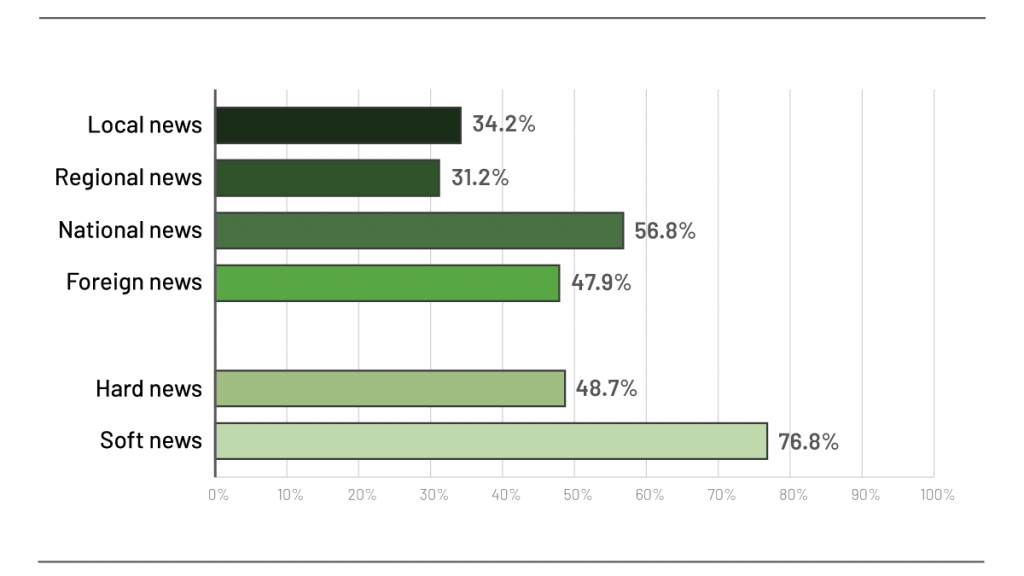
Source: Authors’ own.
Figure 3: Distribution of education (n=1,998)
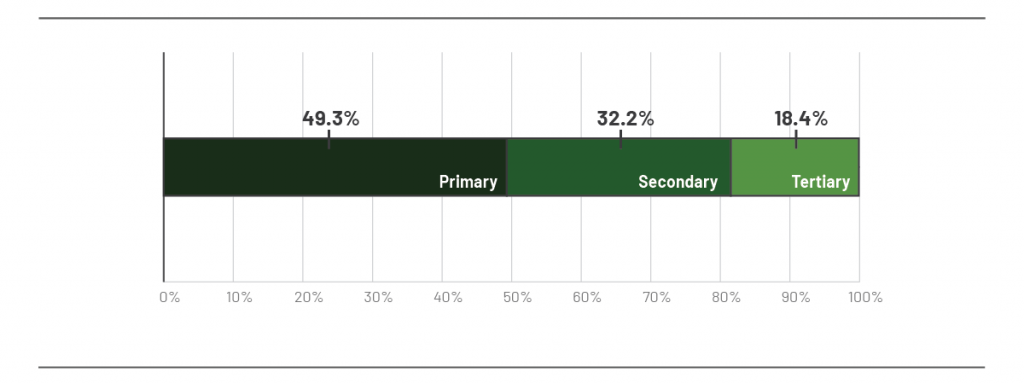
Source: Authors’ own.
Figure 4: Distribution of frequency of news consumption (n=1,998)
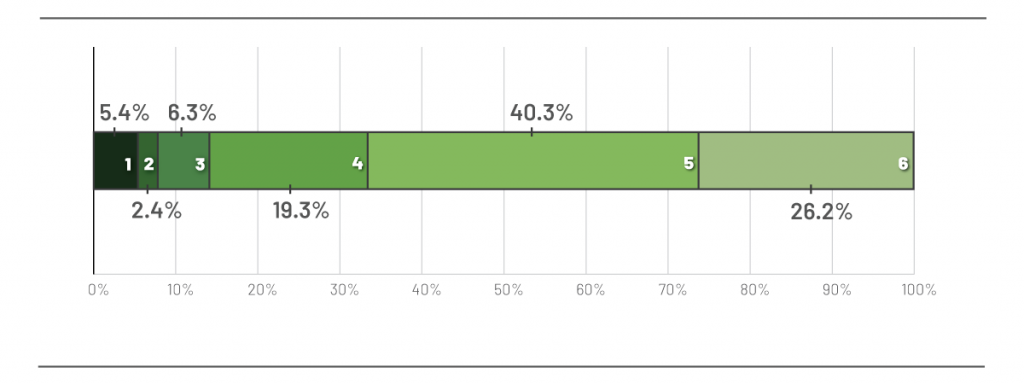
Source: Authors’ own.
Figure 5: Distribution of centre/periphery variable (n=1,998)
Source: Authors’ own.
Figure 6: Distribution of the clusters within the sample (n=1,998)
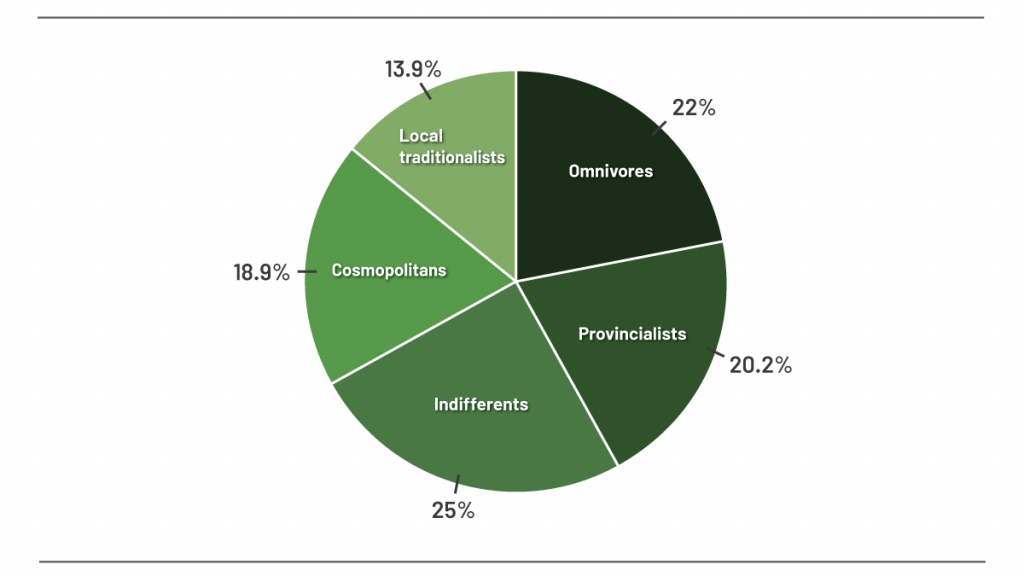
Source: Authors’ own.
Figure 7: How the audience members obtain local news (n=1,998)
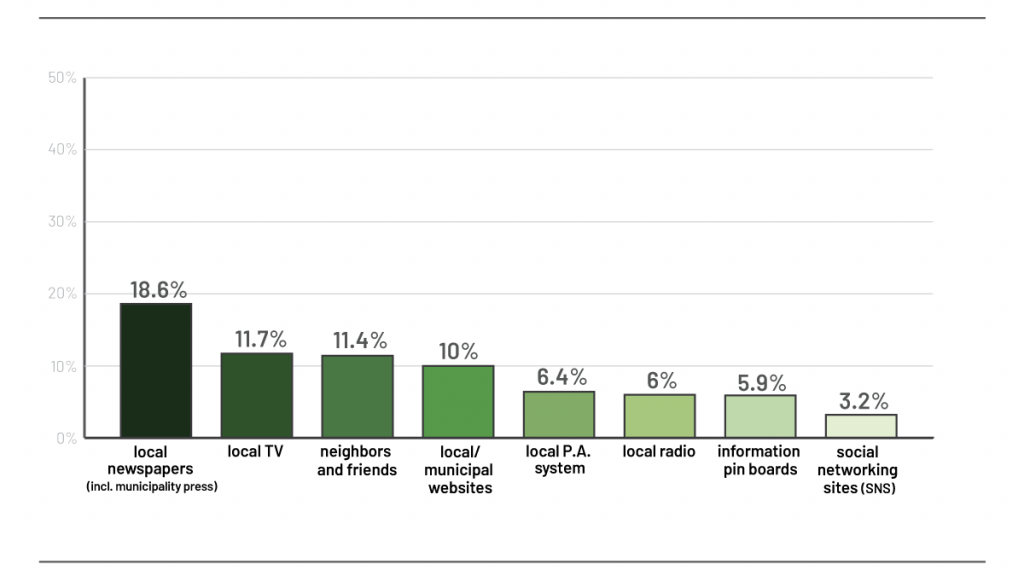
Source: Authors’ own.
Tables
Table 1: Distribution of the entering variables within the clusters (n=1,998)
| Interest in local news | Interest in regional news | Interest in national news | Interest in foreign news | |
|---|---|---|---|---|
| Omnivores | 72.30% | 100% | 86.80% | 100% |
| Provincialists | 21.30% | 45.20% | 78.70% | 0% |
| Indifferents | 0% | 0% | 0% | 0% |
| Cosmopolitans | 0% | 0% | 69.30% | 100% |
| Local traditionalists | 100% | 0% | 62.60% | 50.20% |
Table 2: Multinomial regression, parameter estimates (n=1,998)
| The reference category: Indifferents | ||||||||
|---|---|---|---|---|---|---|---|---|
| Omnivores | Provincialists | Cosmopolitans | Local traditionalists | |||||
| B (S.E.) | OR | B (S.E.) | OR | B (S.E.) | OR | B (S.E.) | OR | |
| Intercept | -5.290 (.472)*** | -4.041 (.407)*** | -2.901 (.386)*** | -3.579 (.442)*** | ||||
| Centre/periphery | -.112 (.088) | .894 | -.008 (.086) | .992 | -.199 (.088)* | .820 | -.211 (.095)* | .810 |
| Frequency of news consumption | .790 (.084)*** | 2.203 | .862 (.076)*** | 2.368 | .710 (.074)*** | 2.035 | .686 (.083)*** | 1.986 |
| Hard news | 1.222 (.165)*** | 3.395 | -.550 (.160)*** | .577 | .312 (.157)* | 1.366 | .109 (.170) | 1.116 |
| Soft news | 1.010 (.224)*** | 2.746 | -.026 (.184) | .975 | -.063 (.184) | .939 | .397 (.213) | 1.487 |
| Age | .017 (.005)*** | 1.017 | .010 (.005)* | 1.010 | .003 (.005) | 1.003 | .008 (.005) | 1.008 |
| Sex (male) | .087 (.154) | 1.091 | -.210 (.151) | .811 | .161 (.152) | 1.175 | -.440 (.166)** | .644 |
| Primary ed. (ref. cat.: Tertiary ed.) | -.792 (.211)*** | .453 | -.178 (.222) | .837 | -.609 (.211)** | .544 | -.182 (.236) | .833 |
| Secondary ed. (ref. cat.: Tertiary ed.) | -.603 (.221)** | .547 | .037 (.232) | 1.037 | -.345 (.220) | .708 | -.145 (.249) | .865 |
| Model c2 (df) | 5318.509 (32)*** | |||||||
| R2 (Nagelkerke) | .310 | |||||||
| R2 (Cox & Snell) | .297 | |||||||