

geographic distribution
GIS
local news
spatial point pattern analysis
Geospatial tools
For the visualization and analysis of local news distribution
Claus Rinner, Ryerson University,
Andrew Komaromy, Ryerson University
April Lindgren, Ryerson University
Keywords
Abstract
Geographic Information Systems (GIS) enable the integration, mapping, and analysis of data across numerous domains. It has been estimated that 80 per cent of all data collected by governments and businesses contain geographic references, and the news media are no exception. [read more=”Read More” less=”Read Less”] We will explain how we conceptualize news items as spatial data points and illustrate how GIS can be used to manage and analyze them using a sample of geographic references from local news items published in the Toronto Star newspaper. The analysis makes use of cartographic mapping for visual analysis of local news distribution and geospatial tools for quantitative–statistical analysis of emerging patterns. The objective of this paper is to illustrate how computer-based mapping tools can be used to analyze the geographic distribution of news in order to identify concentrations and gaps in local news coverage within a given area and thus better understand issues and trends in local news reporting. [/read]
Introduction
C omputer mapping software is a standard feature of the reporter’s toolkit in today’s newsrooms (Herzog, 2003; Vallance-Jones & McKie, 2009), extending the history of map use in journalism (Monmonier, 1999). Sui and Goodchild (2011) call journalism “a professional activity that is inherently embedded in space and time” (p. 1740) and remind us that one of the guiding questions for news writers is “where?” Geographic information systems (GIS) bring together statistical and spatial data in ways that allow journalists to investigate and visually convey information on everything from the association of green spaces and neighbourhood wealth to public transit access and recent patterns in city-wide home sales.
The present study moves beyond the journalists’ use of computer-based mapping software for news reporting purposes to focus instead on how scholars can use GIS tools to answer questions about what, where, and why news gets covered. The mapping of geographic references from news stories and photographs can reveal different patterns of coverage by different media outlets. This research explores how GIS-based tools for visualization and point pattern analysis can be used to understand and critique the spatial distribution of local news. Combined with demographic and socio-economic data, news mapping can explain differences in coverage patterns as well as the role that news reporting plays in geographic stigmatization, citizen engagement, equitable access to information, and the shaping of a news audience’s sense of place.
The paper starts with a literature review that explores the growing interest in media geography (Section 2). In Section 3 we outline how a data set representing the geography of local news coverage in the Toronto Star newspaper was assembled based on the coding of story topics and geographic references in local news stories and photos. The visualization and analysis methods explained in Section 4 include point and proportional symbol mapping; Kernel density estimation; hot spot analysis; and local indicators of spatial association. These methods are then applied to the sample data that represent the geographic footprint of the Toronto Star (Section 5). Section 6 concludes the paper with a discussion of results and limitations, and an outlook on future research.
Geography and the news media
The use of digital mapping as a research tool has grown exponentially among scholars in disciplines outside of geography (Allen & Queen, 2015; Ballas, Clarke, Franklin, & Newing, 2017) because, as landscape architect and theorist James Corner has observed, a map is “a collective enabling enterprise, a project that both reveals and realizes hidden potential” (1999, p. 213). Researchers with an interest in crime analysis, income and inequality, and environmental justice, to name just a few examples, have recognized the value of advances in mapping software that allow for the combination of vast amounts of spatial and other types of data. Visualizations produced in this way have the potential to reveal previously undetected patterns and relationships and to generate new research questions.
The natural affinity between geography and journalism has long been evident. Proximity—the physical closeness of an event to the coverage area of a news outlet—influences decisions about the news that gets reported in local media and the news that gets ignored (Shoemaker, Lee, Han, & Cohen, 2007). The images, information, and ideas that are central to news coverage also play an important role in shaping perceptions of a geographically defined place among outsiders and the people living in that place (Buchanan, 2009; Lindgren, 2011).
A 2005 survey that investigated journalists’ use of GIS tools found that 63 per cent of participating reporters knew of GIS whereas only 11 per cent had used GIS themselves (Wasike, 2005). Since then, GIS has been more widely adopted, not only by reporters but also by scholars who study journalism and journalism practice. Waters, Hansen, Sun, Gao, Palacios, and ReMartiez (2006) examined how media influenced the electoral process in Peru. In addition to mapping the locations of newspaper headquarters and TV and radio stations along with socio-economic and electoral results data, Waters et al. (2006) used geographically weighted regression that allowed NGOs and political parties to monitor the democratic process and the influence of media in elections. The results were displayed on a prediction map showing the percentage of obtained votes in order to help predict future election results. As part of the Mapping the Media in the Americas project, Waters, Hansen, and Sun et al. (2007) also developed an interactive web-based GIS tool to graphically display and analyze which electoral districts were reached by the media. The mapping, along with a comparative analysis, was conducted for Canada and four South and Central American countries. Statistical and spatial methods such as the Gini Coefficient, Moran’s I, Geary’s C, buffers, wave propagation models, and digital elevation methods were used to examine the relationships between socio-economic factors, election results, and locations of media outlets.
The emergence of the now-defunct journal Aether: The Journal of Media Geography, was another indication of the growing interest in the relationship between geography and media (Mahtani, 2007). The journal added to the limited body of research on the geography of news content. For example, Howe (2009) suggested that the commercial value of news audiences may influence the selection of places deemed newsworthy. In addition, cities were more likely mentioned in conjunction with neighbouring cities than with distant ones, suggesting a distance-decay function in news coverage. Tietler, Lieberman, Panozzo, Sankaranarayanan, Samet, and Sperling (2008) developed a system that collects, analyzes, and displays geographic references from news stories in a map interface. The system is highly automated, using RSS feeds from thousands of online news sources, and retrieving articles within minutes of publication. The system allows users to pan and zoom via a map interface, and browse stories by topic, but it provides articles at a relatively coarse level of geography, collecting articles by city or neighbourhood reference only. Gasher (2009) examined the geography of the origin, source, and topic of editorial content in the New York Times, Chicago Tribune, and Los Angeles Times. He concluded that these news outlets reinforced proximity as a news value, and that researchers also need to account for the economic value of news coverage, particularly in topics where coverage is extensive, such as sports and arts and entertainment.
In a series of publications, Lindgren developed a methodology for mapping local news (2009a) and analyzed newspaper coverage of marginalized neighbourhoods in the City of Toronto (2009b). She went on to explore the way in which an ethnic newspaper portrayed place (Lindgren, 2011) and to also to investigate methodologies for visually analyzing local news patterns and their relation to disadvantaged neighbourhoods, emergency calls, and actual crime rates (Lindgren & Wong, 2012). Most recently, Lindgren, Hodson, and Corbett (2017) explored Canada’s “local news poverty” by mapping changes to local news outlets across the country.
Overall, the literature includes a growing body of work examining the connections between media and geography, but only one project (Lindgren, 2009a, b; Lindgren & Wong, 2012) involved news mapping at a detailed geographic level within a city. Similarly, it appears that researchers with the exception of Waters et al. (2006, 2007) have made little use of spatial analysis techniques in their investigations of the geography-media relationship.
Case study data
This study explores how visualization and analysis techniques in GIS can be used to examine the geography of news. To accomplish this, we used a data sample drawn from a content analysis of local news stories and photographs in 28 issues of the Toronto Star between January and August, 2008 (Local News Research Project, 2017). Constructed week sampling using Monday from the first week, Tuesday from the second week, etc., ensured that content from different days was examined and that major news events did not distort the data. Coders derived the geographic references for each news item from both explicit mentions of places and the locations associated with the sources mentioned or quoted. The geographic data contain references to point, line, and polygon features, depending on whether the news item referred to a specific address or building, to a road or river, or to an area such as a neighbourhood, city, or region.
Based on the approach just described, a news story about a school bus accident at the corner of Yonge Street and Dundas Street in downtown Toronto would generate individual point features on the map for the location of the accident, the location of the school attended by the children on the bus, the hospital where injured passengers were treated, and the headquarters of the Toronto Police Service if a police official was quoted. If the story mentioned that the majority of the children were from a particular Toronto neighbourhood, the neighbourhood would be included in the geospatial data set for that story. Coders also assigned a subject code to each story—the bus accident story would be assigned to the “fire/accident” category—so that the pattern of coverage for specific story topics could also be examined.
While the complete dataset is identical to the one developed and used by Lindgren (2009a), for the purpose of this paper, we selected a subset of 1,725 news items that included only point references across the Greater Toronto Area. Non-point references were excluded because of their coarser scale and the difficulty of defining conceptual points to represent them. While many local news items referenced area or line geography, they usually also included point locations that fell within those areas or along those lines. The selected news items each contain an average of just over two references for a total of 3,610 locations (including duplicates referenced in separate news items).
The five general subjects that occurred most frequently in the Toronto Star’s local news coverage were sports, arts & entertainment, police/crime, business, and land use/development (see Table 1). News items belonging to these five categories along with all coded news items were analyzed in this research.
Table 1: General subject codes, description, and frequency among local news items and geographic references included in those items
| Code | General Subject | Item Count | Ref. Count |
|---|---|---|---|
| SP | Sports | 302 | 435 |
| AE | Arts/entertainment/local attractions | 267 | 531 |
| PO | Police/crime/legal/courts/local public safety | 263 | 532 |
| BU | Business | 164 | 367 |
| LU | Land use/urban design/development/redevelopment | 106 | 314 |
| MU | Municipal politics/services/budget | 87 | 218 |
| TR | Transit/gridlock/sprawl/traffic/cycling issues | 81 | 195 |
| OT | Other/pets/travel/human interest | 78 | 150 |
| RI | Religious-cultural diversity/multiculturalism/immigration | 74 | 157 |
| SO | Social supports/Affordable housing/poverty/social justice | 55 | 149 |
| FA | Fire/accident | 53 | 111 |
| ED | Education | 49 | 125 |
| EW | Environment/weather | 46 | 119 |
| HE | Health/health protection/medical | 42 | 111 |
| FP | Federal or provincial politics/initiatives – local angle | 32 | 55 |
| NS | Local impact of national security/terrorism/… | 26 | 41 |
| 1725 | 3610 |
The data were entered into an Esri Personal GeoDatabase using Microsoft Access. Coding was performed by the project’s principal investigator and a research assistant, and inter-coder reliability testing ensured that the interpretation of coding procedures by each coder resulted in significant agreement. Each geographic reference was geocoded or associated with pre-existing features in Esri’s ArcMap. Geographic references were stored within an embedded related sub-table, which permitted the handling of any number of geographic references from individual news items during data entry. The process helped enforce referential integrity, cascading updates, and the deletion of related fields and records in Microsoft Access.
The spatial data for all geographic references were stored in their own layer and related to the news item data tables using a primary key field. To link news contents and geographic references, a one-to-many relationship class was created. This allows the relationship to be called on demand. For example, if the locations of all geographic references in an article are required, the article’s record is selected from the table of news items and then its relationship class associated with the reference data is called. As a result of this call, the selection is passed on to its associated table and the related geographic locations are selected and shown on the map. From here, the data can be exported as a new dataset and further analysis can be performed. A duplication of points occurred if more than one article referenced the same location. Multiple points at the same location contain the information from each news item associated with that location.
For some steps in this research, the data were extracted such that there were subsets based on the most popular general subjects. In this paper, we apply point pattern analysis and other spatial analysis techniques to all news items as well as to select subsets using the GIS tools described in the following section.
Point pattern analysis methods
Point pattern analysis techniques are employed to describe the spatial distribution of “events” that can be represented as points in geographic space or a series of such points. Although this type of analysis has rarely been performed on news coverage, there are numerous examples from other disciplines. For example, the U.S. Department of Justice provides an in-depth guide to point pattern analysis of crime data (Eck, Chainey, Cameron, Leitner, & Wilson, 2005). The documented methods include standard deviational ellipses and tests for clustering. In the area of real estate valuation, researchers have examined socio-economic characteristics and housing prices using spatial autocorrelation statistics (Can, 1998; Han, 2006; Liu, Li, Sun, & Ma, 2006). Epidemiology, ecology, urban geography, and environmental justice are other fields where point pattern analysis has been used to identify significant spatial clusters.
Visual analysis of spatial point patterns
To gain a basic understanding of the spatial coverage of local news items, the raw data were visualized on maps, in which each item was represented by a point symbol. This was done for all news items and for the five subsets by general subject area. The point distribution was combined with a base map for geographic orientation. The base map included municipal boundaries and labels (City of Toronto and surrounding regional municipalities), highways and major roads, as well as Lake Ontario.
The standard deviational ellipse is a common way to assess the geographic trend of a set of points. It involves calculating the standard distance in the x and y coordinate directions. The standard deviation of both x and y of all points to the mean centre point determines the orientation of the ellipse and shows if there is elongation in a particular direction (Esri Inc., 2011). The resulting ellipses for each news subset provide visual and quantitative information on the differences in the geographic distribution of local news. Ellipses were created and inspected for all 16 general subjects and mapped for the five most frequent subjects.
While the point map described above will show only one point symbol even where multiple geographic references from different news items overlap, these references can be dissolved into a single point that carries the count of references as a new attribute. This count can then be translated into a proportional symbol map that shows each reference location with a circle (or other symbol), the size of which is proportional to the count.
Kernel density estimation shows the density of event distributions as a smoothed surface by placing a kernel function, similar to a normal curve, at each data point. The study area is then divided into a grid based on a chosen cell size and the overlapping kernel functions are summed to create the surface as a GIS raster file. The selection of the cell size determines the resolution, whereas the search radius determines the smoothing of the surface. A cell size of 50 metres and a search radius of two kilometres were used for density estimation of all news items and separately for the police/crime news.
Spatial clustering of point locations
Spatial statistics allow the analyst to derive conclusions that cannot be obtained from simple visualization. Ripley’s K function can be used to determine if clustering exists in point data. In ArcMap, this method is known as “multi-distance spatial cluster analysis” (Esri Inc., 2011). This function distinguishes spatial clustering at a range of distances chosen by the analyst. The tool determines the average number of points within each distance band around each point. Clustering is confirmed for an evaluation distance if its concentration of points is higher than that of a random distribution of the same number of points across the study area. Conversely, a dispersed point pattern is confirmed if the concentration is lower than that of a random point cloud. The K function was run on the unweighted, overlapping points representing local news items in order to capture clustering of locations, not of values assigned to these locations (Esri Inc., 2011). A confidence envelope can be calculated and point clustering (dispersion) can be determined as statistically significant at the distances where the K function is above (below) the upper (lower) value of the confidence envelope.
Hot spot analysis is another tool that examines each point (local news item) in the context of neighbouring points. However, it determines clustering based on attribute values attached to the point rather than the point location itself. In this case, the attribute was the word count of the news item that was referenced at the point. Hot spot analysis produces two results for each point, a Z–score and a p–value (Esri Inc., 2011). These indicate whether high or low numbers of news items are spatially clustered, and whether the clustering is statistically significant. Higher positive Z–scores indicate greater clustering of high values, known as a hot spot, whereas lower negative Z–scores show clustering of low values, or a cold spot. Similar to Ripley’s K function, an expected value is compared to the actual value at each location. The key difference is that the hot-spot analysis produces results for each point, rather than characterizing the overall point distribution.
Local Indicators of Spatial Association (LISA) (Anselin, 1992) apply to areal data. Therefore, the geographic references were aggregated to the boundaries of the City of Toronto’s 140 social planning neighbourhoods. Since raw-count data are sensitive to the size of enumeration units such as the Toronto neighbourhoods, density values were created by dividing the number of reference points falling into each neighbourhood by the surface area of the neighbourhood. ArcMap’s “cluster and outlier analysis” function (Esri Inc., 2011) then produces a Z–score and p–value by calculating the local Moran’s I value and a code representing a cluster type. The tool identifies statistically significant clusters of high or low values, indicated as high-high (HH) or low-low (LL) cluster types, as well as outliers where high values are surrounded by low values (HL) or low values are surrounded by high values (LH).
Results – The geographic footprint of the Toronto Star
Visual analysis of local news coverage
The point symbols in Figure 1 represent the locations referenced in Toronto Star stories and photos during the study period. The map shows that there are many reference points in the downtown core of the City of Toronto. Towards the inner suburbs of the city as well as in the surrounding regional municipalities, the references become more dispersed.
Based on colour coding, the distributions of the most common subject types appear to be similar to the overall coverage pattern. Sports news (blue) is the most concentrated, with a few frequently referenced major arenas in the downtown core near Lake Ontario (i.e., Air Canada Centre and Rogers Centre/SkyDome) and few references anywhere else. Crime-related news (red) appears to have a similar pattern with the most frequent references clustering in the north end of the downtown core where the Toronto Police Service headquarters are located and a scattered pattern with dispersed low- and medium-frequency locations across the rest of the city. When a police source was quoted in a story, the headquarters were coded as the location if the source was not associated with a different police division. The central business district in the downtown area also is where most business-related news (green) is located. News related to land use and urban development (grey) is similarly concentrated in the downtown core, and extends outward along major roads, where notable development and land use conflicts tend to occur. Finally, the arts and entertainment category (orange) shows a more linear pattern in the downtown area along major roads such as Yonge Street, King Street West, and Front Street, where many entertainment facilities are located. There are few geographic references outside downtown, and fewer of these locations have multiple references.
Figure 1: Overall point distribution and standard deviational ellipses for all news (white) and for the five most common general news subjects (see details in text)
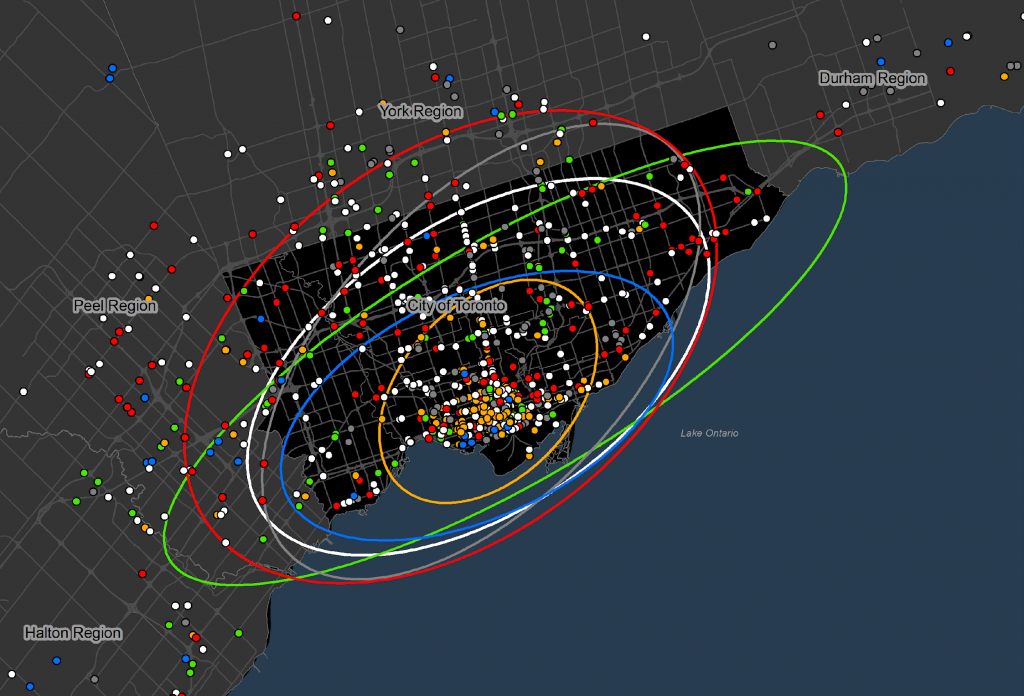
Figure 1 also shows the standard deviational ellipses as a generalized spatial representation of all news items and of the thematic subsets. The centres of all ellipses lie within, or just north of, the downtown core. Their rotation is similar, as it follows the direction of the Lake Ontario shoreline. But the ellipses differ in size and shape. The distribution of all news items (white) is medium in size and elongation. The distribution of sports news (blue) is smaller, representing a greater concentration of reference points (major sports venues referenced multiple times) in the downtown core. The distribution of police/crime stories (red) is considerably larger and wider than most other distributions, covering the northwest corner of the City of Toronto and extending into the City of Mississauga within Peel Region. The distribution of business news (green) has the most elongated shape reaching from areas near Lake Ontario in Peel and Halton Region across the City of Toronto to Durham Region. Although land use/development (grey) is the most “geographical” of all five common general subjects, its spatial distribution is the most similar to the distribution of all news items. It could be considered the most “representative” of general news coverage among the five themes. Finally, the geographic references in arts and entertainment stories (orange) have the smallest footprint, likely due to a very high concentration of arts and entertainment venues in the downtown core of the City of Toronto. Thus, news coverage of arts and entertainment could be viewed as the most limited, spatially.
Figure 2: Proportional symbol map based on the frequency with which each location was mentioned across different news items
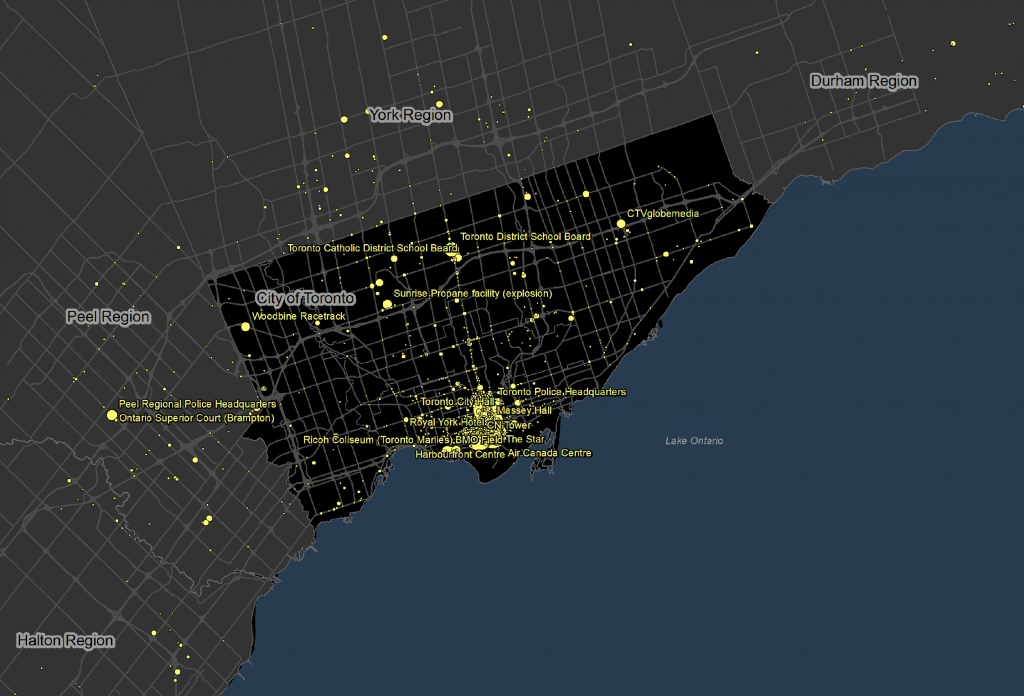
The map in Figure 2 shows the same geographic reference locations as Figure 1, but uses the frequency with which each location was referenced to scale the circle symbol proportionally. This map confirms the same concentration of local news in downtown Toronto, while highlighting that select downtown locations were also much more frequently referenced than most other locations and thus dominated news coverage. Locations with frequencies of 10 or more (up to 160 for Toronto City Hall) are labelled. They include major sports arenas and entertainment venues. A few frequently mentioned reference locations, often police headquarters, were also dispersed throughout the suburbs.
Figure 3: Kernel density maps for (a) all news, and (b) police/crime news
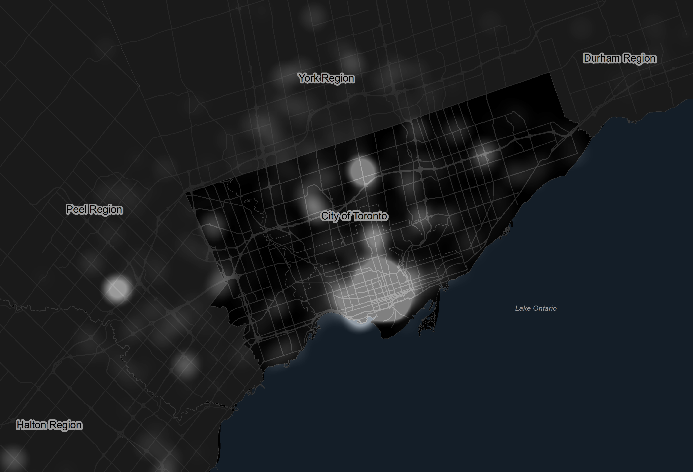
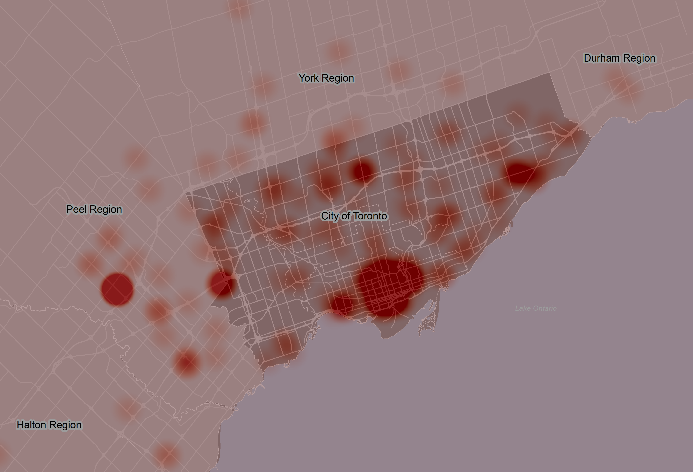
Figure 3 displays the kernel density estimation for all news and for crime-related news. The density symbols are made semi-transparent so that the Toronto neighbourhood boundaries are partially visible for orientation. High values (lighter grey for all news and darker red for police news) represent greater densities of the corresponding geographic references. Not surprisingly, the density of geographic references for all news items produces the highest density in the downtown core with few other, isolated high-density areas. By contrast, the police/crime news exhibits high-density areas in several sections of the study area, in line with the greater coverage observed through the standard deviational ellipse shown in Figure 1.
Spatial clustering of local news
The multi-distance spatial cluster analysis suggests that clustering occurs through multiple spatial levels. Figure 4 shows that up to distances of around 50 kilometres, the observed K values are above the expected K values for the distribution of all news. A technical difficulty with Ripley’s K function prevented the calculation of a “confidence envelope”, which could be used to confirm the distances at which clustering is statistically significant. Nevertheless, we can establish that clustering is greatest for distances between 2 kilometres and 20–25 kilometres. In other words, within these distances from each news item, there is a likelihood to find more of other news items than if news were randomly distributed across the study area. For reference of distances in the study area, Figure 5 (discussed in the next paragraph) includes 10 kilometre distance bands centred around the mean centre point of the distribution.
Figure 4: Results of multi-distance spatial cluster analysis using Ripley’s K function in ArcMap
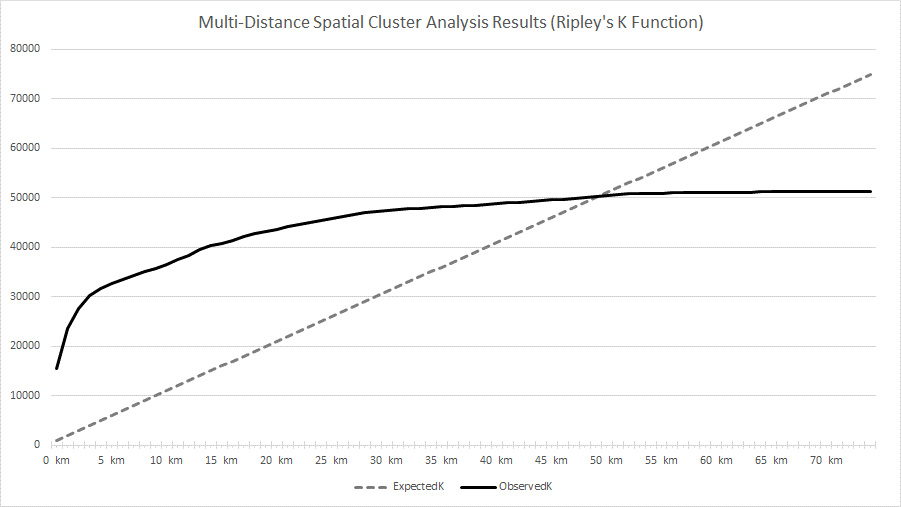
Figure 5: 10 kilometre distance bands (around the mean centre of all reference locations) and hot spots and cold spots of local news distribution
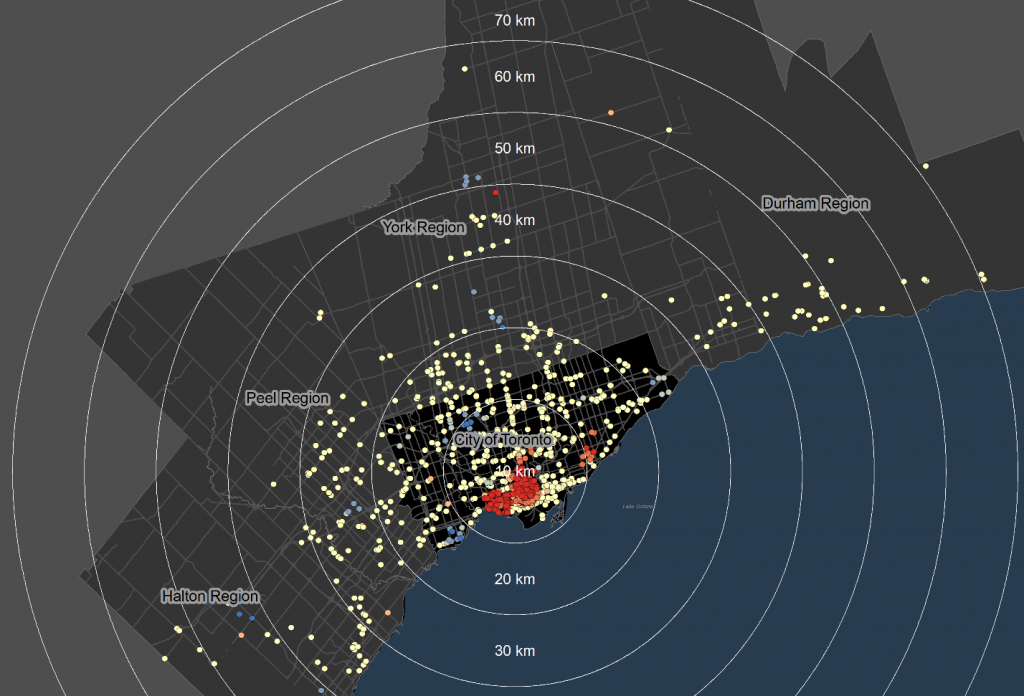
The hot spot analysis yielded statistically significant hot spots (indicating high concentration of news) and cold spots (indicating dispersed news) in the point distribution. Figure 5 shows that a large cluster of hot spots (red dots) is located once again in the downtown core of the City of Toronto with a connected group of hot spots just west of downtown and another smaller one to the east. There also are statistically significant cold spots (blue dots) to the north and west of the downtown.
Figure 6: Density of local news by Toronto neighbourhoods; hatch pattern indicates a statistically significant cluster of high news density in the downtown core
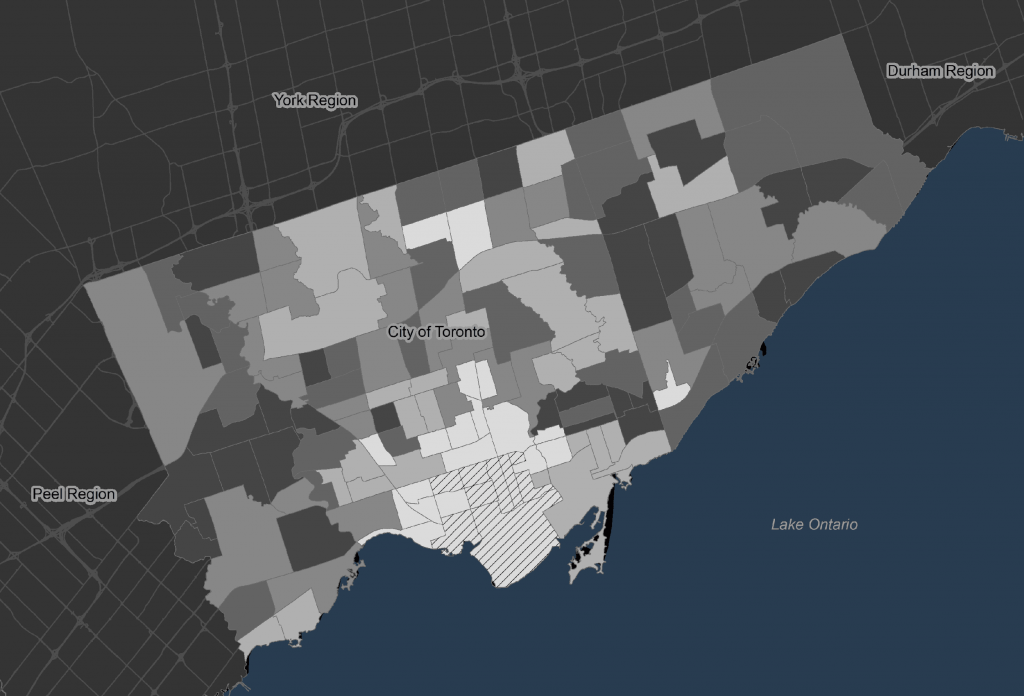
A final tool that can be used to analyze concentrations of news coverage is illustrated in Figure 6. The LISA analysis identifies clusters and outliers on the basis of aggregated news reference points. The density of local news by Toronto neighbourhood shows somewhat of an irregular pattern with high densities (light grey colour) concentrated in downtown but also just east of downtown and towards the north and northwest of the city. The downtown core once again emerges as the only statistically significant pattern with a concentration of high-high values.
Discussion and conclusion
The goal of this paper was to illustrate a range of techniques in GIS that are available to visualize and analyze the spatial distribution of news. A data set based on place references in Toronto Star news items about the Greater Toronto Area was used to demonstrate how these computer-based software tools offer insight into the geographic focus of the Star’s overall news coverage, the focus of beats ranging from crime to sports, and its use of institutional and other story sources.
Point maps and standard deviational ellipses provide a general overview of the data distribution. This output allows for different distributions to be compared and could be used to develop initial hypotheses about the relationships between distributions. The point map of place references derived from Toronto Star news items immediately revealed that while the Star’s geographic footprint is evident throughout the Greater Toronto Area, it treads lightly in most areas except the downtown core. The data visualization made evident the extent to which most of the newspaper’s coverage is concentrated. The application of standard deviational ellipses provides additional insight into how the coverage patterns varied depending on the news topic. Arts and entertainment coverage, for instance, was highly concentrated downtown while reporting on crime stories was more widespread. The visualizations made possible by the point maps and deviational ellipses suggest some obvious directions for future research: To what extent does the newspaper’s focus on the city centre fuel Toronto’s urban-suburban tensions? Does crime coverage mirror the crime rates in different parts of the city?
Proportional symbol maps that reflect the frequency of geographic references show the pattern of distribution with a degree of detail that would be suitable for exploratory data analysis. Results derived from these maps could be processed further to show only the results of interest, rather than large groups of points that overlap one another. This analysis technique highlights the value of GIS tools in knowledge creation by revealing how certain institutions dominate news coverage. The high number of references to city hall and police headquarters, for instance, points to journalists’ reliance upon official sources for information and raises questions about the inclusion of diverse voices in the newspaper’s coverage. The location of the Toronto Star’s own offices in the city centre and the absence of suburban neighbourhood bureaus may be contributing factors in that downtown events and institutions are more accessible to reporters than events and institutions in far flung suburbs.
Kernel density estimation is another tool for visualizing patterns of overall news coverage as well as for specific story topics. It allows for conclusions to be drawn about the densities of point distributions and provides a view of the data as a smooth “surface” that has high illustrative value. Multi-distance spatial cluster analysis allows for detection of the distances at which spatial clustering occurs. Analysts can use these results to probe spatial distances for further analyses. For example, we may wonder whether the cluster distances of 2 to 20 kilometres found in this study are related to the distance that a journalist is able or willing to travel to pursue a story.
Finally, the aggregation of news to administrative boundaries such as City of Toronto neighbourhoods allows for a host of comparative analyses. Potential correlations between news coverage and socio-economic variables such as income, racial diversity, business activity, or crime rates can be explored. In this paper, we used the aggregated data alone to find that the high news density in downtown Toronto is statistically significant at the neighbourhood level too.
This study also exemplifies several limitations regarding data and methods. The clustering of geographic references may be a direct result of the underlying distribution of facilities across the study area. Newsroom procedures and the difficulty or ease of acquiring news may also dictate the geography of places referenced in news items (Lindgren, 2009b). This study focused on point pattern analysis and therefore omitted geographic references to extended lines (e.g. highways) and areas (e.g. neighbourhoods). There are no standard guidelines on the handling of geographic reference features, and the choice is ultimately subjective. For example, most online maps today use point markers for all types of features irrespective of their true spatial extent. Daytime population data are difficult to obtain, and therefore accurate population-based densities of geographic references could not be calculated for the neighbourhood aggregation. Generally, many spatial analysis tools require settings that are often left to the analyst’s experience and intuition. One example is the bandwidth and cell size for the kernel density estimation.
Using spatial analysis methods, journalism scholars can determine areas where news coverage is dense or sparse over various themes and periods of time. This approach can be used to develop or confirm hypotheses about news coverage. The analysis of the sample data in this paper confirmed conclusions drawn by Lindgren (2009a, b) and can be used to further explore issues of neighbourhood stigmatization, citizen engagement, and the forging of residents’ sense of place.
The results are also potentially of interest to the news media industry. Comparing news coverage patterns with the readership and circulation patterns of newspapers, for instance, could provide insight into the extent to which news providers are catering to the interests of readers through the provision of targeted neighbourhood and community news. Knowledge of this sort would allow news organizations to focus or shift their coverage or marketing strategy to reach more specific audiences.
Finally, the geovisualization of news coverage data could be of use to citizens concerned about how their neighbourhoods are represented in the news (Lindgren & Wong, 2015). The neighbourhood-by-neighbourhood mapping of local news coverage in an online format would allow residents to explore how their communities are portrayed. Ideally it would also prompt news organizations to think more carefully about the mix of news stories they publish about different neighbourhoods.
Author note
This research was supported by a Standard Research Grant from the Social Sciences and Humanities Research Council of Canada. The authors would like to thank Dr. Doug Banting for helpful early discussions on local news data representation, Ms. Christina Wong for assistance with the data collection, and Ms. Jadah Folliott for helpful comments on an earlier version of this manuscript. Correspondence concerning this paper should be addressed to crinner@ryerson.ca.
References
Allen, T., & Queen, S. (2015). Beyond the map: Unpacking critical cartography in the digital humanities. Visible Language: The Journal of Visual Communication Research, 49 (3), 79–98.
Anselin, L. (1992). Spatial data analysis with GIS: An introduction to application in the social sciences. Santa Barbara, CA: National Center for Geographic Information and Analysis, University of California.
Ballas, D., Clarke, G., Franklin, R. S., & Newing, A. (2017). GIS and the social sciences: Theory and application. Oxford, England: Routledge.
Buchanan, C. (2009). The sense of place in the daily newspaper. Aether: The Journal of Media Geography, 4, 62–84.
Can, A. (1998). GIS and spatial analysis of housing and mortgage markets. Journal of Housing Research, 9 (1), 61–86.
Corner, J. (1999). The agency of mapping: Speculation, critique and invention. In Cosgrove, D. (Ed.), Mapping (p. 213–252). London, England: Reaktion Books. https://doi.org/10.1002/9780470979587.ch12
Eck, J. E., Chainey, S., Cameron, J. G., Leitner, M., & Wilson, R. E. (2005). Mapping crime: Understanding hot spots. Washington, DC: U.S. Department of Justice Office, National Institute of Justice.
Esri Inc. (2011, January 26). ArcGIS Help Library. Retrieved from ArcGIS Resource Center: http://help.arcgis.com/en/arcgisdesktop/10.0/help/index.html on April 12, 2011.
Gasher, M. (2009). Mapping the online news world: A news-flow study of three U.S. dailies. Aether: The Journal of Media Geography, 4, 102–16.
Han, S. S. (2006). Metropolitan real estate analysis using GIS: The area unit problem. The International Conference of Real Estate and GIS (pp. 127–152). Jeju Island, South Korea: The Korea Real Estate Analysis Association.
Herzog, D. (2003). Mapping the news: Case studies in GIS and journalism. Redlands, CA: Esri Press.
Howe, P. D. (2009). Newsworthy spaces: The semantic geographies of local news. Aether: The Journal of Media and Geography, 4, 43–61.
Lindgren, A. (2009a). Mapping local news: A research methodology. Proceedings from the Association for Education in Journalism and Mass Communication annual conference (pp. 1–28). Boston, MA.
Lindgren, A. (2009b). News, geography and disadvantage: mapping newspaper coverage of high-needs neighbourhoods in Toronto, Canada. Canadian Journal of Urban Research, 18 (1), 74–97.
Lindgren, A. (2011). Interpreting the city: Portrayals of place in a Toronto-area ethnic newspaper. Aether: The Journal of Media Geography, 8a, 66–88.
Lindgren, A., & Wong, C. (2012). Want to understand local news? Make a map. Proceedings from the 2012 annual conference of the Canadian Communication Association. Retrieved from http://cca.kingsjournalism.com/?p=169
Lindgren, A., & Wong, C. (2015, August 2). How is your Toronto neighbourhood portrayed in the news? Check it out using these interactive maps. Web site, Local News Research Project. Retrieved from http://localnewsresearchproject.ca/2015/08/02/how-is-your-toronto-neighbourhood-portrayed-in-the-news-check-it-out-using-these-interactive-maps/
Lindgren, A., Hodson, J., & Corbett, J. (2017, January 23). Canada’s local news “poverty.” Policy Options. Retrieved from http://policyoptions.irpp.org/magazines/january-2017/canadas-local-news-poverty/
Liu, Z., Li, M., Sun, Y., & Ma, W. (2006). Study on spatial autocorrelation of urban land price distribution in Changzhou city of Jiangsu province. Chinese Geographical Science, 16 (2), 160–64.
Local News Research Project. (2017, June 26). Local News Research Project data sets. Local News Research Project. Retrieved from http://localnewsresearchproject.ca/2017/06/26/data-sets/
Mahtani, M. (2007). Spatializing storytelling: Contemporary post-binary geographies of new discourse. Aether 1, 31–33.
Monmonier, M. (1999). Maps with the news: The development of american journalistic cartography. Chicago, IL: University of Chicago Press.
Shoemaker, P. J., Lee, J. H., Han, G., & Cohen, A. A. (2007). Proximity and scope as news values. In Devereux, E. (Ed.), Media studies: Key issues and debates (pp. 231–248). Thousand Oaks, CA: Sage.
Sui, D., & Goodchild, M. F. (2011). The convergence of GIS and social media: challenges for GIScience. International Journal of Geographical Information Science, 25 (11), 1737–48.
Tietler, B. E., Lieberman, M. D., Panozzo, D., Sankaranarayanan, J., Samet, H., & Sperling, J. (2008). NewsStand: A new view on news. Proceedings of the 16th ACM SIGSPATIAL International Conference on Advances in Geographic Information Systems (pp. 1–10).
Vallance-Jones, F., & McKie, D. (2009). Computer-assisted reporting: A comprehensive primer. Don Mills, Canada: Oxford.
Wasike, B. S. (2005). The diffusion of GIS in journalism (Doctoral dissertation). Louisiana State University Digital Commons. Retrieved from https://digitalcommons.lsu.edu/gradschool_dissertations/2643
Waters, N., Hansen, C., & Sun, H. (2007). Web-based GIS to explore media influence and election processes. ESRI User Conference (pp. 1–13). San Diego, CA: ESRI.
Waters, N., Hansen, C., Sun, H., Gao, J., Palacios, M., & ReMartiez, C. (2006). Mapping media influence on the electoral process in Peru. ESRI User Conference (pp. 1–11). San Diego, CA: ESRI.