

local news
mapping
local journalism
participatory mapping
crowdsourcing
critical cartography
The Local News Map
Transparency, credibility, and critical cartography
April Lindgren, Ryerson University
Jon Corbett, University of British Columbia
Keywords
Abstract
Widespread disruption has made tracking what is happening to local journalism in Canada a challenge. The Local News Map is a crowdsourced web-based mapping tool that invites the public to contribute information about local newsroom startups, closings, and service reductions/increases. As concerns mount about the future of local journalism, the map’s data are cited with increasing frequency and it has the potential to influence debate, policy, and other research. Taken at face value, the map is a straightforward tracking device. [read more=”Read More” less=”Read Less”]A critical assessment of the assumptions, decision-making, and biases underpinning the map, however, illustrates that nothing is ever quite that simple. Researchers have called for a more critical and reflective approach to the application of geographic information technologies to mapping. This article draws on theories of critical cartography to evaluate the Local News Map’s biases, limitations, and strengths with a view to enhancing its credibility as a research tool. [/read]
Introduction
C ity councillor James Gordon’s indignation was palpable as he talked about what has happened in Guelph, Ontario, following the demise of the 148-year-old Guelph Mercury newspaper in early 2016. In the absence of a daily paper to provide citizens with verified news and information, he told delegates attending a conference on the future of local journalism, extreme views fueled by online comments and blogs are becoming more influential in Guelph, a city of 132,000 located about an hour’s drive west of Toronto (Bala, 2017). Gordon’s concerns were echoed in a subsequent Globe and Mail story about Guelph’s “post-Mercury blues” (Houpt, 2017). An online news site, a rebranded community newspaper, and a local political blogger still provide basic coverage of news and events, the story says. But they are not meeting the needs of a citizenry in “despair over a growing sense that city politics are becoming nastier and more polarized without the moderating influence of a daily” to provide the more in-depth, nuanced stories that inform debate and foster compromise.
Disquiet about the Guelph situation following the loss of the Mercury was soon overshadowed by widespread shock in the fall of 2017 when Postmedia Network Canada Corp. and Torstar Corp. announced a newspaper swap involving 41 papers and the subsequent closing of three dozen of the publications (Evans, 2017). The manoeuvre fuelled speculation about Postmedia’s viability: Ongoing financial losses at the country’s largest newspaper chain (Canadian Press, 2017) have led to round after round of layoffs and cost cutting at its publications which, even after the latest closings, still include more than 40 daily newspapers and upwards of 100 non-daily community papers (Postmedia, 2016).
The fragility of local news ecosystems is not only confined to the newspaper sector. While the major television networks announced new local evening newscasts in a number of markets in 2017 (Bell Media, 2017; Rogers Media, 2017; Watson, 2017), a study commissioned by the lobby group Friends of Canadian Broadcasting has warned that, in the absence of intervention by Canada’s broadcast regulator, more than half of the country’s independent stations (stations not owned by vertically integrated media conglomerates like Rogers and Bell) in small and medium-sized markets will be off the air by 2020 (Friends of Canadian Broadcasting, 2016).
Concerns during the winter of 2016 about the availability of local news in communities across the country prompted the House of Commons Standing Committee on Canadian Heritage to launch hearings on “how Canadians, and especially local communities, are informed about local and regional experiences, through news, broadcasting, digital and print media” (Ditchburn, 2016). During the course of its 18-month Media and Local Communities study, the committee heard repeatedly about the lack of solid information on whether the essential information needs of Canadians are being met. On the second day of hearings in February, 2016, the University of Laval’s Francois Demers testified that it is not clear who the main producers are in terms of local/regional information (Canada, House of Commons, Standing Committee on Canadian Heritage, 2016). Monica Auer, the executive director of the Forum for Research and Policy in Communications, noted that the country’s broadcast regulator, the Canadian Radio-Television and Telecommunications Commission, does not have key data related to local broadcast news. The number of journalists employed by stations and their newsgathering capacity is unknown, she said. No data are available on the amount of local news produced by Canadian radio stations and information on how much original local news television stations produce is unreliable: “There are very few facts about Canadians’ overall access to original local broadcast news concerning their communities or about stations’ capacity to actually gather this news,” Auer concluded (Canada, House of Commons, Standing Committee on Canadian Heritage, 2016, p. 3). Carleton University professor Dwayne Winseck, meanwhile, warned of “severe” shortages of data about changes to the media landscape and observed that there are “a lot of opinions and little data to act upon” (Canada, House of Commons, Standing Committee on Canadian Heritage, 2016, p. 5). In addition to the paucity of local news data for the broadcast sector, there is no comprehensive listing of local online digital news sites, and reliable data on the newspaper sector is increasingly unreliable and unavailable. Since 2011, News Media Canada, which represents daily and community papers (published fewer than four times per week), has tracked developments at its approximately 800 member publications and combined the data on closings, launches, and mergers with details of what is happening at the more than 300 non-member publications identified by its researchers (Kelly Levson, personal communication, August 1, 2017). Many small publications, however, are not included in the list. Moreover, many financially strapped newspapers have discontinued official circulation audits to cut expenses and this has led News Media Canada to stop publishing daily newspaper circulation numbers for individual titles in 2016 (Canadian Media Concentration Research Project, 2017; News Media Canada, n.d.).
The Local News Map, a joint project of researchers at Ryerson University and the University of British Columbia, was created in response to the dearth of reliable information about rapidly evolving local news media ecosystems in Canada. In the same way that the scientific community has appealed to the public for information on everything from bird counts to local environmental assets and hazards (Williamson & Connolly, 2009), the crowdsourced map launched in June, 2016 invites the public to contribute information about changes to local print, digital, and broadcast media news outlets (Ghosh, 2016). Over the first 16 months of its existence, the web-based mapping tool and the data it generates have been cited in numerous stories about the upheaval in Canada’s news industry (Kerr, 2016; Wallace, 2017), referenced in think tank studies (Public Policy Forum, 2017), and highlighted by members of parliament in the Heritage committee’s final report, which urged Canadians to consult the participatory tool to “see the changes affecting the supply of local news in their region” (Canada, House of Commons, Standing Committee on Canadian Heritage, 2017, p. 15).
Given the map’s potential to influence debate and policy making at a time of growing angst about the future of local journalism, important questions about the accuracy of its data and the biases and assumptions embedded in the map-making process merit consideration. In the same way that transparency of journalistic method—making it clear to the audience where and how information was obtained—is considered essential to the credibility of reporters’ work (Kovach & Rosenstiel, 2014), transparency in the map-making process is essential to the Local News Map’s credibility as a tool for research about the state of journalism in Canada. Critical cartographers in the 1980s began challenging the notion of maps as purveyors of objective, neutral truth (Harley, 1989; Kitchin, Perkins, & Dodge, 2009) and more recently scholars have been calling for a similarly critical and reflective approach to cartography that employs geographic information technologies (Allen & Queen, 2015). Mapmakers’ decisions and conscious and unconscious assumptions influence the stories maps tell and therefore need to be critically examined in a way that reveals the iterative, exploratory, and comparative characteristics of maps as well as their less-than-obvious subtexts. This paper deconstructs the Local News Map using this approach. Potential biases and key design decisions that contribute to its strengths and weakness are identified in what is essentially an exercise in transparency, one designed to bolster confidence in the map as a tool for identifying trends, generating research questions, and producing reliable data on changes to local news ecosystems in Canada.
Literature review
Research suggests Canadians value local news. While only 33 per cent of Americans said in a recent survey that they closely follow local news (Barthel & Mitchell, 2017), 92 per cent of respondents in a Canadian poll indicated that news about their communities was either very important (45 per cent) or somewhat important (47 per cent) (Public Policy Forum, 2017). 69 per cent said they would consider it a serious consequence if the decline of Canadian news media led to less coverage of local news. The numbers suggest that Canadians recognize what researchers have argued for some time—that access to verified, timely news is essential to well-functioning communities. A report by the U.S.-based Knight Commission on the Information Needs of Communities in a Democracy, for instance, concluded that information is “as vital to the healthy functioning of communities as clean air, safe streets, good schools, and public health” (Knight Commission, 2009, p. xiii). In addition to providing citizens with the information they need to hold the powerful accountable, the commission noted that access to information connects people in a way that builds community and helps them to come together, collaborate and solve problems. Other research has identified eight specific types of “critical information” that are central to citizens’ ability to function in daily life, make the most of work, education, and other opportunities, and participate in local decision making (Friedland, Napoli, Ognyaova, Weil, & Wilson III, 2012).
Scholars are using traditional news content analysis methodologies to evaluate whether citizens’ need for information about about emergencies and risks, health, education, transportation, economic opportunities, the environment, and civic and political matters are being met (Napoli, Stonbely, McCollough, & Renninger, 2017; Nielsen, 2015). Increasingly, however, web-based geographic information technologies and data visualization are also being adopted as investigative tools (Lindgren & Wong, 2015). Mapping the geographic focus of local news coverage has been the basis for exploring neighbourhood stigmatization in local coverage (Lindgren, 2009), the role that local news reporting in ethnic media plays in forging a sense of place and belonging (Lindgren, 2011, 2015), and how police information units shape news coverage at the community level (Lindgren, 2016).
Mapping is proving to be particularly useful as a tool for tracking situations in flux as the disruption in local news ecosystems gathers momentum. In the United States, The Media Deserts Project is mapping newspaper circulation patterns to pinpoint areas of the country that lack access to timely local news (Ferrier, Sinha, & Outrich, 2016). In the United Kingdom, researchers investigating whether the decline of local newspapers is associated with an emerging democratic deficit have mapped the extent to which different areas are served by daily and weekly newspapers and the diversity of news sources available to local residents. The results of this data visualization point to “unprecedented levels of concentration of ownership and the reduction of competing sources of local news in large sections of the country, including increasing numbers of local news monopolies” (Ramsay & Moore, 2016, p. 69).
The application of geographic information technologies to cartography is appealing in that it allows scholars to move beyond the visualization of fixed data sets to the collection and display of information in a way that lends itself to revealing patterns and trends, generating knowledge, and suggesting future lines of inquiry. Different data sets can be combined to investigate possible relationships between news coverage and demographic and socioeconomic indicators. Increasingly sophisticated tools for extracting geographic references from text, meanwhile, set the stage for better and less costly data collection: The recently launched GDELT API, for instance, machine translates news content produced in 65 languages into English so that the geography of news coverage can be explored at the city, state/provincial, or national level. Entering an English keyword generates a map showing every location mentioned within a sentence or two of the keyword over the previous 24 hours (The GDELT Project, 2017).
Advances in mapping software have also paved the way for researchers to tap the wisdom of the crowd. In the years since Jeff Howe (2006) coined the term “crowdsourcing” to describe how businesses outsource problem-solving to online communities, the public has been invited to generate ideas, address design challenges, contribute real-time information during disasters, complete micro-tasks for labour-intensive projects, develop software and write code, and participate in public consultations (Hossain & Kauranen, 2015; Tripathi, Tahmasbi, & de Vreede, 2017). Citizen science projects, for instance, draw upon local expertise to assemble data on everything from bird sightings (Bush, 2016) to community eco-inventories of green assets (parks) and liabilities (toxic hotspots) (Williamson & Connolly, 2009).
In journalism, news organizations have looked to the crowd for photographs, breaking news updates and help with ongoing investigative projects including the analysis of masses of documents (Ryfe, 2012). Journalism researchers, meanwhile, have embraced participatory or crowdsourced maps to assemble up-to-date information that has been previously unavailable or difficult to access. The “crowd,” for instance, has helped document eye-witness accounts of attacks on reporters in Mexico and Iraq (Tynes, 2013).
While the accuracy and authenticity of crowdsourced data is an ongoing and valid concern, verification protocols are often built into projects. An examination of four crowdsourced projects—they ranged from the collection of species biodiversity data in Ireland to detailed local information for community maps in Canada—identified quality control efforts that included data verification by skilled experts and the cross-checking of data with other databases (Lauriault & Mooney, 2014). Indeed, data supplied by the public may sometimes be of better quality than what is currently available since “some maps can be out of date, and often were created in an era of less accurate measuring instruments” (Lauriault & Mooney, 2014, p. 2).
The innovations in digital cartography, geolocation technology, and participatory mapping have resulted in predictions that mapping will “play a foundational role in the emergence of what we term as geospatial media analytics” (Ferrier et al., 2016, p. 220). This enthusiasm is well-founded. While early Western cartographers were preoccupied with the accuracy and effective communication of detailed but static representations of geography (Kitchin et al., 2009), the dynamic, participatory digital cartography of the 21st century goes beyond transmitting information about what is located where to constructing knowledge. It “allows researchers to take the diverse observations and data they have gathered surrounding a question and its contextual relationship to render new insights and relationships previously unseen” (Allen & Queen, 2015, p. 87).
What hasn’t changed is that contemporary cartography, like earlier map making, is a subjective undertaking: “Maps,” as Harley observed in his seminal paper on critical cartography, “are slippery customers” (1989, p. 8) that reinforce society’s power dynamics and are anything but neutral, objective representations of reality. He suggested that a “rhetorical close reading” (p. 11) of maps is necessary to understand their hidden messages and cartography’s relationship with power. The two intersect, for instance, in the actual map-making process, which involves technical decisions related to the categories and hierarchies of information presented, and the use of images and other rhetorical devices. The impact of maps, Harley concluded, needs to be examined critically because they represent just one version of reality—a version that can either reinforce and legitimize the status quo or a version that can act as an agent of change. “But in either case the map is never neutral” (p. 14).
Harley’s interrogation of what he called the “second text” (1989, p. 9) of maps is no less relevant now that they have evolved beyond static objects to become dynamic research tools capable of assembling, organizing, visualizing, and combining massive amounts data and information to reveal previously unseen patterns and relationships (Kitchin et al., 2009). “Much of the critical literature on and surrounding mapping has focused predominantly on the artifact (i.e. the map itself) as a symbol of values, biases, and assumption and on the part of the mapmakers” Allen and Queen observe (2015, p. 89–90). As map making has changed, they argue, so too must critical thinking and literacy about biases inherent in the new approaches that potentially distort or manipulate the stories maps tell and the conclusions they suggest: “Movement towards this maturity starts with a focused critical reflection on the methods employed and questions asked during the map-making process” (p. 90), they observe.
Allen and Queen theorize that the embedded biases and conscious and unconscious assumptions built into digital maps need to be dissected through critical analyses of their iterative, exploratory, comparative, and textual (as opposed to surface or obvious graphic narrative) characteristics. What decisions were made about the information presented as the iterative map-making progressed? What questions can the map answer and what assumptions are embedded in the questions and answers? To what extent does the map allow for comparisons? And how do early decisions about scale, orientation and other aspects of how the map is displayed affect its narrative? Reflecting critically on these types of questions forces map makers to be transparent about the biases, assumptions, and decisions that shaped both the map-making process and the conclusions suggested by map data.
In what follows, The Local News Map’s iterative, exploratory, comparative, and textual characteristics will be examined in what is really an exercise in transparency—an exercise designed to highlight the underlying factors that shape the map while also contributing to a “greater literacy of the non-neutral processes of map making as preparation for deeper reflection on its use” (Allen & Queen, 2015, p. 95).
The map: Crowdsourcing changes to local news
The Local News Map invites contributors from across Canada to submit information about changes to local news organizations including newsroom closings, startups, and service increases or reductions dating back to 2008. It also displays information on closings due to mergers, new operations created as a result of mergers, and the ownership and language of affected news outlets. The information provided by contributors is displayed in pop-up windows associated with geolocated markers.
Figure 1: The Local News Map: Changes to local news outlets across Canada
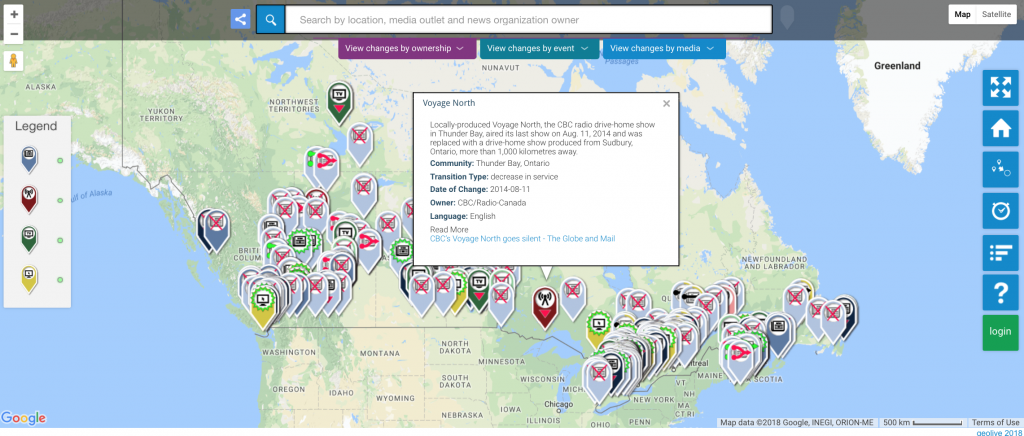
Map users can activate a timeline to view changes that occur over specific years. They can also use filters to view changes across the country by media type (radio, television, newspaper, or born-on-the-web online news sites), by event (launches, closings, etc.) and by company name. The map generates aggregate data—as of December 20, 2017, it displayed 403 markers including 238 representing local media outlets (all types) that have closed since 2008. Another 69 markers documented the launch of new operations. In addition to visually conveying information about massive change and disruption in the local news sector nationwide, the marker data can be downloaded and sorted by province or community, by media type and by news organization ownership. The latest data, for instance, reveals that the 238 closures affected 173 different communities while new outlets were launched in 57 places.
Figure 2: The Local News Map: Filter illustrates changes to local news outlets by type of change
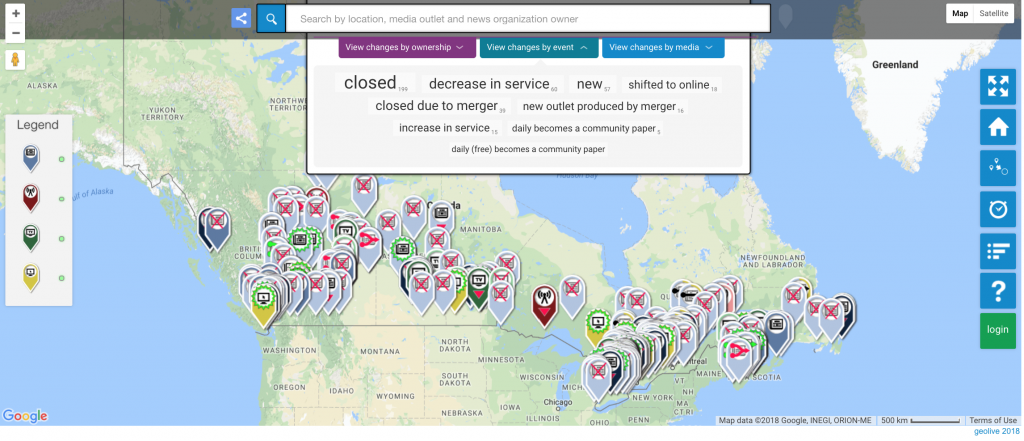
Figure 3: Visit the Local News Map (Video)
Discussion: Critical cartography as an exercise in transparency
To what extent does Hartley’s 1989 characterization of maps as “slippery customers” apply to today’s digital creations? Calls by Allen and Queen (2015) for a critical evaluation of digital map making as an activity and its impact on exploratory research suggests they have their suspicions. In what follows, The Local News Map is used to test their prescription for exposing the “non-neutral” (p. 95) processes of contemporary cartography.
In the first instance, Allen and Queen argue that map making should be examined as an iterative process that contributes to the generation of ideas and identification of biases, assumptions, and decisions that may influence conclusions. Indeed, the iterative process of building The Local News Map required multiple subjective, value-laden decisions. One of the first challenges was defining which news organizations qualify as local—a much-contested concept in journalism scholarship (Ali, 2017). In this case, we settled upon a definition that says a local news outlet is one that demonstrates a commitment to accuracy and transparency, and is devoted primarily to reporting and publishing timely, original news about local people, places, issues, and events. The adoption of this relatively narrow definition means advertising flyers that masquerade as community newspapers and websites that are little more than event listings are excluded from the map. But it also has other implications. Markers highlighting changes to local opinion blogs and Facebook neighbourhood groups, for instance, don’t appear on the map because, although both play a role in information sharing and generation, for the most part they are not in the business of publishing original, verified, timely local news that is reported in a transparent way. Local magazines also aren’t tracked primarily because they tend to appear monthly and therefore do not report news in a timely manner. Having said that, the map design is iterative, so a magazine layer could be added in the future.
Another early but consequential decision involved the handling of information about newsroom layoffs. Reductions in the number of reporters and editors employed by a news organization are all-too-common indicators of eroding local news ecosystems. We decided, however, not to track staff changes on the map primarily because of concerns about verification. Access to information about layoffs is often difficult to obtain because it is not something proprietors are eager to publicize. If information does become available, it can be difficult to categorize. Consider, for instance, a media outlet that lays off seven copy editors but hires four videographers. Is that an overall reduction in service when it comes to the quality and quantity of local news reported in that particular community? A detailed content analysis would provide an answer, but that is beyond the scope of the map. The decision to exclude hiring and layoff data nonetheless means the map does not capture an important aspect of what is happening to local news providers.
The decision to use 2008 as the start date for information displayed on the map also had significant consequences: The choice of 2008 is defensible—the deep recession marked a turning point for many previously profitable local news organizations—but it does mean the map only tells the story of local media over the past disrupted decade. We tend to think of the pre-2008 years as a time of greater stability for local news producers, but the map doesn’t allow for comparisons to test that perception.
While the iterative process of map making required difficult decisions, it also led to improvements. Early tests that involved documenting the closing of several local ethnic media outlets prompted us to require that contributors specify language of operation when they submit information on changes to local media outlets. Creating a French-language version of the map is also being considered to make the resource more accessible to Quebec contributors. The decision to add a timeline to the map, meanwhile, emerged from discussions about how it could be used to display information on trends and the pace of change over the past decade. Finally, as the sheer number of newsroom shutdowns became evident during early efforts to populate the map, it became clear that media ownership should be included with the information for each marker.
Even after its launch, the Local News Map remains a work-in-progress by virtue of its reliance on crowdsourcing. The decision to seek public input was based on sheer necessity: Changes to local news media are ongoing across the country and tracking them without public assistance would be challenging—if not impossible—in terms of time and resources. The gamble has paid off in that the visual story conveyed by 405 markers on the map at of the end of 2017, combined with other information gleaned from its downloaded data, illustrate that “mapping’s greatest benefit comes when seen less as a tool to prove a point and more to illuminate, uncover, and provoke insights and new connections” (Allen & Queen, 2015, p. 91).
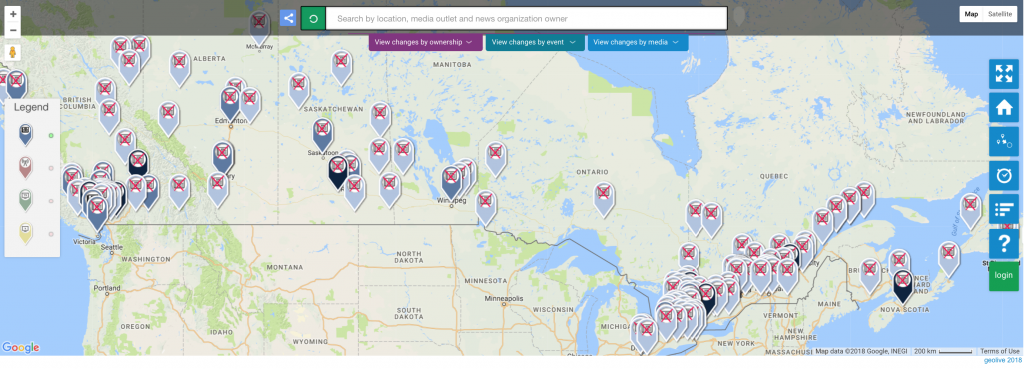
The Local News Map data can be interrogated from multiple perspectives. When the map’s filters are used to display changes to local newspapers, for instance, it reveals clusters of closings in Quebec and in western Canada, many of them instigated by regional publishing chains (Figure 4). The downloaded map data painted a more detailed picture for Canada’s newspaper sector, indicating that as of December 20, 2017, community newspaper losses accounted for 174 of the 238 closing markers (including direct closings and the shutdown due to mergers of publications that appear fewer than five times per week). Together, these observations point to the need for further inquiry into the forces buffeting the community newspaper industry, including the impact of chain ownership.
Figure 4: Changes to community newspapers
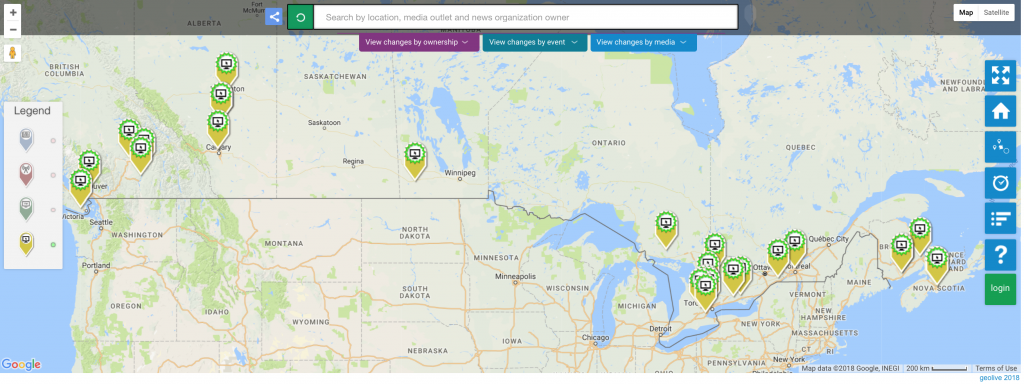
The map also raises questions about the extent to which born-on-the-web local news sites are filling in the gaps left by the loss of more traditional newsrooms (Figure 5). At the end of 2017, for instance, only 28 markers recorded the launch of new online startups. An additional 13 markers detailed the closing of local online sites. The underwhelming numbers suggest more research is required to understand the local conditions that foster—or discourage—digital startups in Canada.
Figure 5: Local news digital startups
The underwhelming numbers, however, may also point to a shortcoming of the crowdsourcing model. The information on display is quality controlled in that each marker is reviewed by the map’s moderators, an undertaking made easier by the link to background information that contributors are asked to provide when they add to the map. Missing information, however, is more problematic. The map’s creators regularly add markers and there is widespread awareness of the tracking tool amongst journalists—the June 14, 2016, J-Source.ca story (Ghosh, 2016) announcing the launch of the map was that month’s most frequently viewed item on the journalism news site. Overall public awareness, however, is undoubtedly less widespread, which is a limitation in terms of tapping into local community-level expertise. Potential contributors who are aware of the map may abandon efforts to add markers if they have trouble navigating the process. And the map’s digital format means adding information is not an option for less web-savvy Canadians and for people in areas of the country with little or no Internet access. In light of these constraints, the limited number of online startups recorded on the map could simply be a function of missing data. More research is required to confirm whether the pattern reflects reality.
In addition to theorizing that maps must be iterative and exploratory, Allen and Queen (2015) suggest their capacity for generating comparisons should be examined. The Local News Map has this capacity. Filters allow users to visually compare how different types of media are faring: Changes to local television outlets since 2008, for instance, can be compared to changes in the radio sector. The map provides a big-picture idea of what is happening to local journalism across Canada, but also allows users to zoom in to examine changes at the community level. The timeline can also be used to compare startup and shutdown activity for different time periods over the past decade. But again, comparisons are only as valid as the data on the map and should therefore be considered the starting point for investigation rather than the end point.
Finally, deconstructing the messages communicated by maps requires that the “map maker be not only aware of, but in command of, how abstraction and translation processes inform the map’s rhetorical nature” (Allen & Queen, 2015, p. 92). At the most basic level, the decision to use a red X to indicate the closing of a local news outlet and a green halo for markers recording the launch of new operations embodies a value judgment i.e. shutdowns are bad news while the launch of a news outlet is a positive development. The map’s protocol for displaying markers also tends to understate the churn because in communities where multiple local news outlets have experienced change and only the name of the community is provided (as opposed to a specific address), the markers are placed at the geographic centre of the city or town and therefore layer one on top of the other, masking the extent of disruption.
Deconstructing the iterative, exploratory, comparative, and textual characteristics of the Local News Map is an exercise in critical reflection and transparency, one designed to systematically reveal the map’s “backstory.” The biases, strengths, and limitations identified through this process did not come as news to the map’s creators. The exercise did, however, highlight the need to ensure the same insights are available to the public and researchers who might be considering using the data. The map’s introductory page has from the start included a definition of what qualifies as a local news outlet and indicated clearly that newsroom hires and layoffs are not tracked. In the interests of transparency and credibility, however, the introduction has been updated to include:
- the rationale for excluding magazines
- an explanation for the choice of 2008 as the start date for data collection
- a note indicating that the content for each marker is verified by the map’s moderators
- a reminder that the map data change constantly because the Local News Map is crowdsourced
Conclusion
It has been nearly 30 years since critical cartographers got serious about challenging assumptions that maps are neutral, objective representations of absolute truth. Maps today, however, can still be credible instruments of translation, persuasion, abstraction, visualization, and exploration if their creators are transparent about the biases, underlying decisions, and assumptions that inform their map-making process.
Journalism practice is instructive in this respect. Kovach and Rosenstiel (2014) observe that journalists cannot claim to be objective: they have biases and viewpoints like all human beings and they must make editorial decisions at every stage of the information-gathering and writing process. They argue, however, that journalists can be objective in their methods—an argument that is particularly relevant in this age of faltering confidence in the news media. Journalistic credibility, they suggest, is borne of a stalwart commitment to verification, transparency as to how information is collected and verified, and clear acknowledgment about what elements of a story remain unknown. Audience members can then judge for themselves the credibility of what has been reported.
Allen and Queen (2015) proffer the cartographic equivalent of this objectivity of method in their call for a “critical evaluation of the activity of map making (i.e. the conditions that inform the activity of mapping and visualization and how to go about it) and its impact on the propositional nature of exploratory research (i.e. how the activity of mapping affects the decision that researchers make about where, how, and to what extent to intervene)” (p. 79). The application of this approach to The Local News Map suggests it is an effective way to identify the map’s biases, strengths, and limitations as a research tool. As a result of this exercise, the map’s website was updated to include a more transparent discussion of these biases, strengths, and limitations with a view to enhancing its credibility. Taken at face value, The Local News Map is a straightforward tracking device that reports on changes to local news outlets across Canada.
Deconstructing the map’s iterative, exploratory, comparative, and textual characteristics, however, illustrates that nothing is ever quite that simple.
Author note
This research is supported by the Social Sciences and Humanities Research Council of Canada (SSHRC), the SSHRC-funded Canadian Geospatial and Open Data Research Partnership, the Canadian Media Guild/CWA Canada, Canadian Journalists for Free Expression, the MITACS Accelerate Program, Unifor, and Ryerson University. Many thanks to Tania Allen for taking the time to discuss her research and to research assistants Eliana Macdonald, Christina Wong, Avneet Dhillon, and Allison Ridgway for their help with this project.
References
Ali, C. (2017). Media localism: The policies of place. Champaign, IL: University of Illinois Press.
Allen, T., & Queen, S. (2015). Beyond the map: Unpacking critical cartography in the digital humanities. Visible Language: The Journal of Visual Communication Research, 49 (3), 79–98. Retrieved from https://design.ncsu.edu/co-lab/wp-content/uploads/2015/12/Visible-Language-CM-2015-Allen-Queen-78-99.pdf
Bala, J. (2017, June 27). Local news important for connecting community members, say panelists. Ryerson Journalism Research Centre. Retrieved from http://ryersonjournalism.ca/2017/06/27/local-news-important-for-connecting-community-members-say-panelists/
Barthel, M., & Mitchell, A. (2017, May 10). Interest in national news increases sharply among Democrats. Americans’ attitudes about the news media deeply divided along partisan lines. Pew Research Centre. Retrieved from http://www.journalism.org/2017/05/10/interest-in-national-news-increases-sharply-among-democrats/
Bell Media. (2017, June 7). CTV Ottawa expanding local coverage with CTV News at 5. CTV News Ottawa. Retrieved from https://ottawa.ctvnews.ca/ctv-ottawa-expanding-local-coverage-with-ctv-news-at-5-1.3447400
Bush, D. (2016, January 15). Crowdsourcing for better science and governance? Geothink.ca. Retrieved from http://geothink.ca/crowdsourcing-for-better-science-and-governance/
Canada, House of Commons, Standing Committee on Canadian Heritage. (2016). Evidence. 42nd Parl., 1st sess. 5, February 25. Retrieved from http://www.parl.gc.ca/content/hoc/Committee/421/CHPC/Evidence/EV8128452/CHPCEV05-E.PDF
Canada, House of Commons, Standing Committee on Canadian Heritage. (2017). Disruption: Change and churning in Canada’s media landscape. 42nd Parl., 1st Session. Retrieved from http://www.ourcommons.ca/Content/Committee/421/CHPC/Reports/RP9045583/chpcrp06/chpcrp06-e.pdf
Canadian Media Concentration Research Project. (2017). The growth of the network media economy in Canada, 1984–2016. Retrieved from http://www.cmcrp.org/the-growth-of-the-network-media-economy-in-canada-1984-2016/
Canadian Press. (2017, April 6). Postmedia plans more cost-cutting as revenue falls again. Toronto Star. Retrieved from https://www.google.ca/amp/s/www.thestar.com/amp/business/2017/04/06/postmedia-posts-smaller-losses-but-revenue-declines-by-135-per-cent.html
Ditchburn, J. (2016, February 17). Panel of MPs to examine issue of local news crisis, media concentration. CBC. Retrieved from http://www.cbc.ca/news/politics/federal-committee-newsroom-closures-1.3451513
Evans, P. (2017, November 27). Postmedia and Torstar swap dozens of small newspapers, most to be shut down. CBC. Retrieved from http://www.cbc.ca/news/business/postmedia-torstar-1.4420955
Ferrier, M., Sinha, G., & Outrich, M. (2016). Media deserts: Monitoring the changing media ecosystem. In Lloyd, M. & Friedland, L. A. (Eds.), The communication crisis in America, and how to fix it (pp. 215–231). New York, NY: Palgrave Macmillan.
Friedland, L., Napoli, P., Ognyaova, K., Weil, C., & Wilson III, E. J. (2012). Review of the literature regarding the critical information needs of the American public. Retrieved from https://transition.fcc.gov/bureaus/ocbo/Final_Literature_Review.pdf
Friends of Canadian Broadcasting. (2016, June 20). Local TV in crisis: A briefing note [Blog post]. Retrieved from https://www.friends.ca/blog-post/13521
Ghosh, I. (2016, June 14). Crowd-sourced map tracks what’s happening to local news outlets across Canada. J-Source: The Canadian Journalism Project. Retrieved from http://www.j-source.ca/article/crowd-sourced-map-tracks-what%E2%80%99s-happening-local-news-outlets-across-canada
Harley, J. B. (1989). Deconstructing the map. Cartographica, 26 (2), 1–20. https://doi.org/10.3138/E635-7827-1757-9T53
Hossain, M., & Kauranen, I. (2015). Crowdsourcing: A comprehensive literature review. Strategic Outsourcing: An International Journal, 8 (1), 2–22. https://doi.org/10.1108/SO-12-2014-0029
Houpt, S. (2017, July 22). Guelph’s post-Mercury blues: How an Ontario city is coping without its local newspaper. Globe and Mail. Retrieved from https://www.theglobeandmail.com/news/national/guelph-mercury-ontario/article35731429/
Howe, J. (2006). The rise of crowdsourcing. Wired, 14 (6), 1–4.
Kerr, J. (2016, November 9). As the ink fades. J-Source: The Canadian Journalism Project. Retrieved from http://www.j-source.ca/article/ink-fades
Kitchin, R., Perkins, C., & Dodge, M. (2009). Thinking about maps. In Dodge, M., Kitchin, R., & Perkins, C. (Eds.), Rethinking maps (pp. 1–25). New York, NY: Routledge.
Knight Commission on the Information Needs of Communities in a Democracy. (2009). Informing communities: Sustaining democracy in the digital age. Washington, DC: The Aspen Institute. Retrieved from http://asne.org/files/633903476823578892InformingCommunities.pdf
Kovach, B., & Rosenstiel, T. (2014). The elements of journalism: What newspeople should know and the public should expect (3rd ed.). New York, NY: Three Rivers Press.
Lauriault, T. P., & Mooney, P. (2014). Crowdsourcing: A geographic approach to public engagement. Retrieved from https://papers.ssrn.com/sol3/papers.cfm?abstract_id=2518233
Lindgren, A. (2009). News, geography and disadvantage: Mapping newspaper coverage of high-needs neighbourhoods in Toronto, Canada. Canadian Journal of Urban Research, 18 (1), 74–97. https://doi.org/10.1017/S0008423914000912
Lindgren, A. (2011). Interpreting the city: Portrayals of place in a Toronto-area ethnic newspaper. Aether: The Journal of Media Geography, 8a, 68–88.
Lindgren, A. (2015). Municipal communication strategies and ethnic media: A settlement service in disguise. Global Media Journal: Canadian edition – Multicultural Media and Immigrant Integration, 8 (2), 49–71.
Lindgren, A. (2016). Aiding and abetting: How police media information units shape local news coverage. In Richardson, C. & Smith Fullerton, R. (Eds.), Covering Canadian crimes: What journalists should know and the public should question (pp. 193–216). Toronto, Canada: University of Toronto Press.
Lindgren, A., & Wong, C. (2015). How is your Toronto neighbourhood portrayed in the news? Check it out using these interactive maps. Local News Research Project. Retrieved from http://localnewsresearchproject.ca/2015/08/02/how-is-your-toronto-neighbourhood-portrayed-in-the-news-check-it-out-using-these-interactive-maps/
Napoli, P. M., Stonbely, S., McCollough, K., & Renninger, B. (2017). Local journalism and the information needs of communities: Toward a scalable assessment approach. Journalism Practice, 11 (4), 373–395. https://doi.org/10.1080/17512786.2016.1146625
News Media Canada. (n.d.). Daily newspaper circulation data. Retrieved from https://nmc-mic.ca/about-newspapers/circulation/daily-newspapers/
Nielsen, R. K. (2015). Local newspapers as keystone media: The increased importance of diminished newspapers for local political information environments. In Nielsen, R. K. (Ed.), Local journalism: The decline of newspapers and the rise of digital media (pp. 51–72). London, England: I.B Tauris & Co.
Postmedia Network Canada Corp. (2016). Annual information form. Retrieved from http://www.sedar.com/GetFile.do?lang=EN&docClass=1&issuerNo=00031322&issuerType=03&projectNo=02556008&docId=4017730
Public Policy Forum. (2017). Shattered mirror: News, democracy and trust in the digital age. Retrieved from https://shatteredmirror.ca/download-report/
Ramsay, G., & Moore, M. (2016). Monopolizing local news: Is there an emerging local democratic deficit in the U.K. due to the decline of local newspapers? London, England: CMCP, Policy Institute, King’s College London.
Rogers Media. (2017). Rogers Media expands CityNews across Canada. [Press Release]. Retrieved from http://www.rogersmediatv.ca/pr_detail.php?id=1420
Ryfe, D. M. (2012). Can journalism survive? An inside look at American newsrooms. Cambridge, England: Polity Press.
The GDELT Project. (2017, April 26). GDELT GEO 2.0 API debuts! [Blog Post]. Retrieved from http://blog.gdeltproject.org/gdelt-geo-2-0-api-debuts/
Tripathi, A., Tahmasbi, N., & de Vreede, G.-J. (2017). Theoretical fashions in crowdsourcing: A snapshot of IS research. Published in the proceedings of the 50th Hawaii International Conference on System Sciences, Waikoloa, HI. Retrieved from http://hdl.handle.net/10125/41235
Tynes, N. (2013, November 20). Interactive map uses crowdsourcing to record attacks on journalists in Iraq. International Journalists’ Network. Retrieved from http://ijnet.org/blog/interactive-map-uses-crowdsourcing-record-attacks-journalists-iraq
Wallace, C. (2017, February 4). Journalists are vanishing: Who will fill the void? The Toronto Star. Retrieved from https://www.thestar.com/news/atkinsonseries/newnewsroom/2017/journalists-are-vanishing-who-will-fill-the-void.html
Watson, H. G. (2017, June 8). CTV expands 5 p.m. local newscasts to nine new cities. J-Source: The Canadian Journalism Project. Retrieved from http://www.j-source.ca/article/ctv-expands-5-pm-local-newscasts-nine-new-cities
Williamson, D., & Connolly, E. (2009). Theirwork: The development of sustainable mapping. In Dodge, M., Kitchin, R. & Perkins, C. (Eds.), Rethinking maps (pp. 97–112). New York, NY: Routledge.